

Q 11-02-073JEE MainJEE Main 2023 (30 Jan, Shift 1)Medium
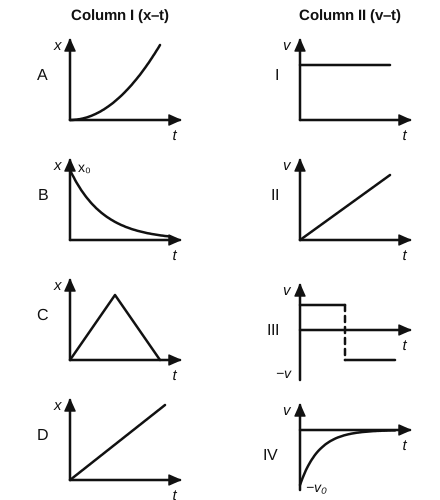
Match Column I with Column II.
Column I shows position–time ($x$–$t$) graphs A, B, C, D and Column II shows velocity–time ($v$–$t$) graphs I, II, III, IV, as in the figure.
Choose the correct answer from the options given below:
Answer: (A) A-II, B-IV, C-III, D-I
Velocity is the slope of the $x$–$t$ graph.
- A: slope grows uniformly from zero → $v$ increases linearly → II.
- B: $x$ decreases from $x_0$ with slope going from a large negative value to zero → $v$ rises from $-v_0$ towards 0 → IV.
- C: constant positive slope, then constant negative slope → III.
- D: constant slope → constant $v$ → I.
 Solution by Sreeraj P, M.Sc Physics