

Q 11-04-128JEE MainJEE Main 2023 (1 Feb, Shift 2)Easy
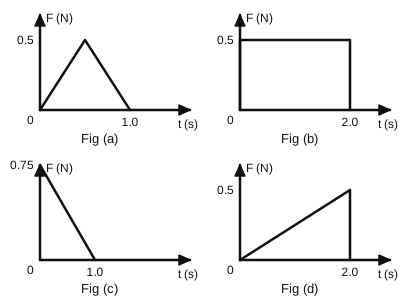
Figures (a), (b), (c) and (d) show variation of force with time. The impulse is highest in figure
Answer: (B) Fig (b)
Impulse is the area under the $F$–$t$ graph: (a) $\tfrac12\times1\times0.5=0.25$; (b) $2\times0.5=1.0$; (c) $\tfrac12\times1\times0.75=0.375$; (d) $\tfrac12\times2\times0.5=0.5$ N s. Largest in (b).
 Solution by Sreeraj P, M.Sc Physics