

Q 11-04-104JEE MainJEE Main 2023 (30 Jan, Shift 1)Medium
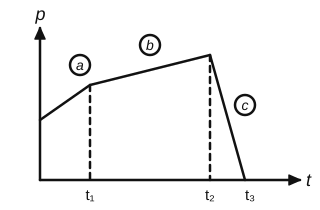
The figure represents the momentum–time ($p$–$t$) curve for a particle moving along an axis under the influence of the force. Identify the regions on the graph where the magnitude of the force is maximum and minimum respectively. (Given $t_3-t_2<t_1$)
Answer: (C) c and b
Force is the slope of the $p$–$t$ graph, $F=\dfrac{dp}{dt}$.
Region c has the largest change of momentum in the shortest time (and $t_3-t_2<t_1$), so the steepest slope: maximum force. Region b is the flattest: minimum force.
 Solution by Sreeraj P, M.Sc Physics