

Q 11-12-042JEE MainJEE Main 2024 (4 Apr, Shift 1)Easy
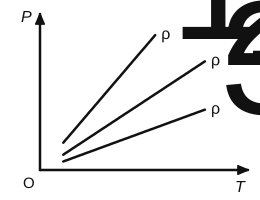
The $P$-$T$ diagram of an ideal gas having three different densities $\rho_1, \rho_2, \rho_3$ (in three different cases) is shown in the figure. Which of the following is correct?
Answer: (A) $\rho_1 > \rho_2$
For an ideal gas $P = \dfrac{\rho RT}{M}$, so the slope of the $P$-$T$ line is proportional to the density.
The $\rho_1$ line is the steepest, then $\rho_2$, then $\rho_3$: $\rho_1 > \rho_2 > \rho_3$.
 Solution by Sreeraj P, M.Sc Physics