

Q 11-11-165JEE MainJEE Main 2017 (9 Apr)Easy
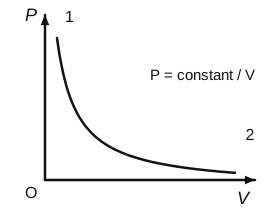
For the $P$–$V$ diagram given for an ideal gas, the gas goes from state $1$ to state $2$ along the curve $P = \dfrac{\text{constant}}{V}$. Out of the following, which one correctly represents the $T$–$P$ diagram?
Answer: (B) see figure
$PV = \text{constant}$ means $nRT = PV$ is constant: the process is isothermal. On a $T$–$P$ diagram it is a horizontal line.
From $1$ to $2$ the volume increases, so the pressure decreases: state $2$ is at lower $P$, i.e. to the left of state $1$. This is graph (2).
 Solution by Sreeraj P, M.Sc Physics