

Q 11-11-140JEE MainJEE Main 2020 (8 Jan, Shift 1)Medium
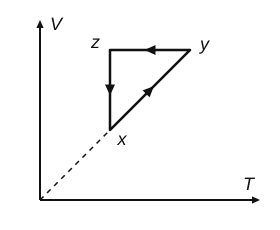
A thermodynamic cycle $xyzx$ is shown on a $V$-$T$ diagram. The $P$-$V$ diagram that best describes this cycle is: (Diagrams are schematic and not to scale)
Answer: (A) see figure
Read each step from the $V$-$T$ diagram:
$x \to y$: a straight line through the origin, $V \propto T$, so the pressure is constant while the volume increases (isobaric expansion).
$y \to z$: $V$ constant while $T$ falls, so the pressure decreases (isochoric).
$z \to x$: $T$ constant while $V$ decreases, so the pressure rises along a hyperbola $PV$ = constant (isothermal compression).
On a $P$-$V$ diagram: a horizontal line to the right, then a vertical line down, then an isothermal curve back up to the left. This is diagram (1).
 Solution by Sreeraj P, M.Sc Physics