

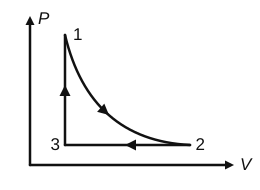
Which of the following is an equivalent cyclic process corresponding to the thermodynamic cycle given in the figure? Here, $1 \to 2$ is adiabatic. (Graphs are schematic and are not to scale)
Answer: (C) see figure
Read each step off the P-V graph and translate it to V-T:
$3 \to 1$: constant volume, pressure (and so temperature) rises. In V-T this is a horizontal line towards higher $T$.
$1 \to 2$: adiabatic expansion, $TV^{\gamma-1} = $ constant. Volume increases while temperature falls, along a curve.
$2 \to 3$: constant pressure compression, $V \propto T$. This is a straight line that would pass through the origin, with both $V$ and $T$ decreasing.
Only graph (C) has the horizontal $3\to1$, the curved $1\to2$ and the straight $2\to3$ line.
 Solution by Sreeraj P, M.Sc Physics