

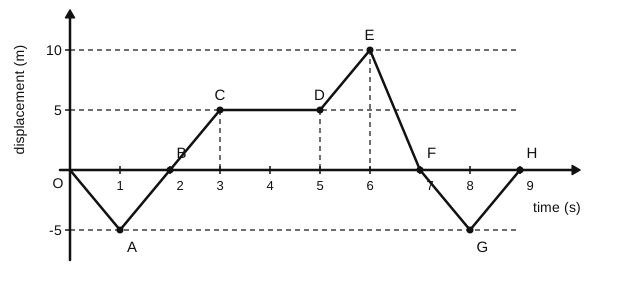
The displacement $x$ versus time graph is shown in the figure.
(A) The average velocity during 0 to 3 s is $10\ \text{m/s}$
(B) The average velocity during 3 to 5 s is $0\ \text{m/s}$
(C) The instantaneous velocity at $t = 2\ \text{s}$ is $5\ \text{m/s}$
(D) The average velocity during 5 to 7 s and the instantaneous velocity at $t = 6.5\ \text{s}$ are equal
(E) The average velocity from $t = 0$ to $t = 9\ \text{s}$ is zero
Choose the correct answer from the options given below:
Answer: (D) (B), (C), (E) only
Read the corner points: $(0, 0)$, $(1, -5)$, $(2, 0)$, $(3, 5)$, $(5, 5)$, $(6, 10)$, $(7, 0)$, $(8, -5)$, $(9, 0)$.
- (A) $\dfrac{5 - 0}{3} = \tfrac53\ \text{m/s}$, not 10 ✘
- (B) $x$ is $5\ \text{m}$ at both 3 s and 5 s, so the average velocity is 0 ✔
- (C) From 1 s to 3 s the graph is a straight line of slope $\dfrac{5 - (-5)}{2} = 5\ \text{m/s}$ ✔
- (D) Average from 5 s to 7 s: $\dfrac{0 - 5}{2} = -2.5\ \text{m/s}$; at 6.5 s the slope is $\dfrac{0 - 10}{1} = -10\ \text{m/s}$ ✘
- (E) $x = 0$ at both 0 s and 9 s, so the average velocity is 0 ✔
Answer: (B), (C), (E) only.
 Solution by Sreeraj P, M.Sc Physics