

Q 11-03-174JEE MainJEE Main 2025 (3 Apr, Shift 1)Easy
The angle of projection of a particle is measured from the vertical axis as $\phi$ and the maximum height reached by the particle is $h_m$. Which graph (shown in the figure) correctly represents $h_m$ as a function of $\phi$ for $0 \le \phi \le 90^\circ$?
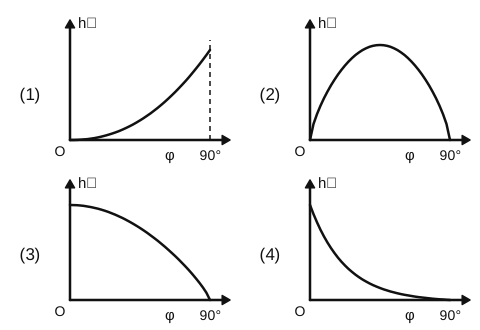
Answer: (C) Graph (3)
The vertical component of the launch velocity is $u\cos\phi$, so
$$h_m = \frac{u^2\cos^2\phi}{2g}$$
At $\phi = 0$ (straight up) $h_m$ is greatest, and it falls to zero at $\phi = 90^\circ$. Near $\phi = 0$, $\cos^2\phi$ has zero slope, so the curve starts flat and bends down to meet the axis at $90^\circ$. This is graph (3).
 Solution by Sreeraj P, M.Sc Physics