

Q 11-10-068JEE MainJEE Main 2023 (25 Jan, Shift 2)Medium
The graph between two temperature scales $P$ and $Q$ is shown in the figure. Between upper fixed point and lower fixed point there are $150$ equal divisions of scale $P$ and $100$ divisions on scale $Q$. The relationship for conversion between the two scales is given by
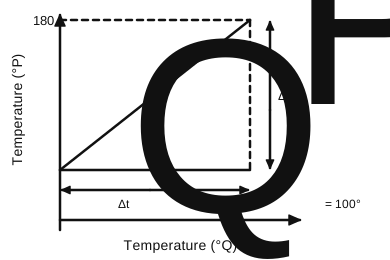
Answer: (B) $\dfrac{t_Q}{100}=\dfrac{t_P-30}{150}$
The upper fixed point is $180$ on $P$, and there are $150$ divisions, so the lower fixed point is $180-150=30$ on $P$ (and $0$ on $Q$).
$$\frac{t_Q-0}{100}=\frac{t_P-30}{150}$$
 Solution by Sreeraj P, M.Sc Physics