

Q 12-12-096JEE MainJEE Main 2021 (24 Feb, Shift 1)Easy
In the given figure, the energy levels of hydrogen atom have been shown along with some transitions marked $A$, $B$, $C$, $D$ and $E$.
The transitions $A$, $B$ and $C$ respectively represent
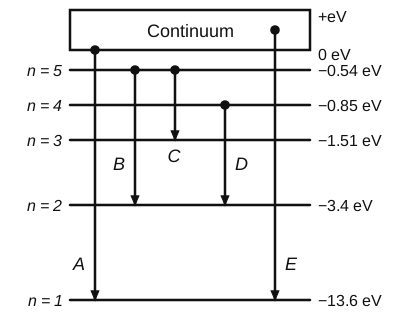
Answer: (C) The series limit of Lyman series, third member of Balmer series and second member of Paschen series.
$A$: from the continuum (energy 0) to $n = 1$, the shortest-wavelength Lyman line, i.e. the series limit of the Lyman series.
$B$: $n = 5 \to 2$. Balmer lines are $3\to2$ (first), $4\to2$ (second), $5\to2$ (third), so $B$ is the third member of the Balmer series.
$C$: $n = 5 \to 3$. Paschen lines are $4\to3$ (first), $5\to3$ (second), so $C$ is the second member of the Paschen series.
 Solution by Sreeraj P, M.Sc Physics