

Q 11-13-122JEE MainJEE Main 2021 (27 Aug, Shift 1)Medium
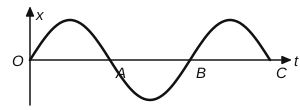
The variation of displacement with time of a particle executing free simple harmonic motion is shown in the figure. The potential energy $U(x)$ versus time $(t)$ plot of the particle is correctly shown in figure:
Answer: (D) see figure
$U = \frac{1}{2}kx^2$ is never negative and is zero whenever $x = 0$, i.e. at $O$, $A$, $B$, $C$. Between these instants it rises to a maximum (at the extreme positions) and falls back.
Since $x \propto \sin\omega t$, $U \propto \sin^2\omega t$: a series of identical humps above the axis touching zero at $O$, $A$, $B$, $C$. Its period is half that of $x$.
 Solution by Sreeraj P, M.Sc Physics