

Q 11-02-050JEE MainJEE Main 2026 (24 Jan, Shift 2)Medium
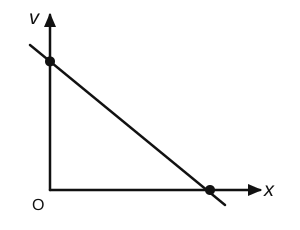
The velocity $(v)$ - Distance $(x)$ graph is shown in figure. Which graph represents acceleration(a) versus distance ( $x$ ) variation of this system?
Answer: (D) see figure
From the graph, $v = v_0 - kx$ (straight line, negative slope $-k$).
$$a = v\frac{dv}{dx} = (v_0 - kx)(-k) = -kv_0 + k^2x$$
So $a$ is a straight line in $x$ with a **positive** slope $k^2$ and a **negative** intercept $-kv_0$. It becomes zero at $x = v_0/k$, the same point where $v = 0$, and is positive beyond it. This is graph (D).
 Solution by Sreeraj P, M.Sc Physics