

Q 11-02-005NEETNEET 2024Top questionEasy
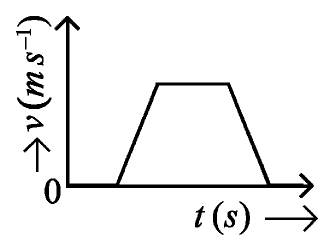
The velocity ($v$) – time ($t$) plot of the motion of a body is shown below. The acceleration ($a$) – time ($t$) graph that best suits this motion is :
Answer: (A) see figure
Acceleration is the slope of the $v$-$t$ graph.
First the velocity is zero, so $a = 0$.
Then $v$ rises linearly: a constant positive acceleration.
Then $v$ stays constant: $a = 0$.
Then $v$ falls linearly to zero: a constant negative acceleration.
Finally $v = 0$ again: $a = 0$.
The $a$-$t$ graph is therefore zero, a positive step, zero, a negative step, then zero. This is option (1).
 Solution by Sreeraj P, M.Sc Physics